
Research By: Dhruv Gupta
In the world of financial analysis, understanding a company’s profitability often requires looking deeper into its financial statements. One of the most effective tools for this is the DuPont Analysis. Originating from the DuPont Corporation in the 1920s, this method breaks down a company’s return on equity (ROE) into various components, offering insights into how well a company is generating returns for its shareholders. The DuPont framework can be approached in various ways, each providing different levels of detail.
What is DuPont Analysis?
DuPont Analysis is a framework used to break apart the underlying ratio components of the return on equity (ROE) metric to determine the strengths and weaknesses of a company. It is a tool that may help us to avoid misleading conclusions regarding a company’s profitability.
The Foundation: Return on Equity (ROE)
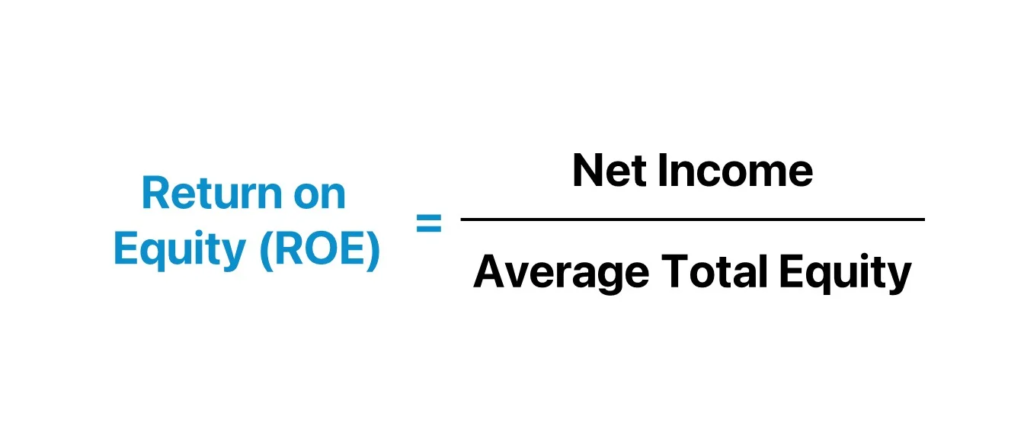
Return on Equity (ROE) is one of the most widely used metrics in financial analysis, serving as a key indicator of a company’s profitability relative to shareholders' equity. Essentially, ROE tells us how effectively a company is using the money invested by its shareholders to generate profits. It is calculated as:
A higher ROE generally suggests that a company is efficient in generating profit with the equity it has at its disposal. However, while ROE is a powerful metric, it doesn’t always tell the full story as this number can also increase simply when the company takes on more debt, thereby decreasing shareholder equity, this would increase the company's leverage, which could be a good thing, but it will also make the stock riskier.That’s where DuPont Analysis comes into play.
There are three major financial metrics that drive ROE:
- Operating efficiency, which is represented by net profit margin or net income divided by total sales or revenue.
- Asset use efficiency, which is measured by the asset turnover ratio.
- Financial leverage, a metric that is measured by the equity multiplier, which is equal to average assets divided by average equity.
The Need for DuPont Analysis
While ROE provides a snapshot of financial performance, it doesn’t break down the underlying factors contributing to that performance. DuPont Analysis breaks ROE into multiple components, offering a clearer view of what drives profitability. By breaking ROE down into its constituent parts, it can identify whether high ROE is driven by operational efficiency, effective asset use, or financial leverage.
The Basic Model or Three - Step Approach
In the DuPont Analysis the traditional ROE components- Net Income and is broken down into three components- net profit margin (how much profit the company makes from its revenues), asset turnover (how effectively the company uses its assets), and equity multiplier (a measure of the company's leverage).
ROE = Net profit margin x Asset turnover x Equity multiplier
Where:
Net Profit Margin = Net Income/ Sales
Asset Turnover = Sales/ Average Total Assets
Equity Multiplier = Average Total Assets/ Average Shareholder’s Equity
Thus, the expanded formula becomes:
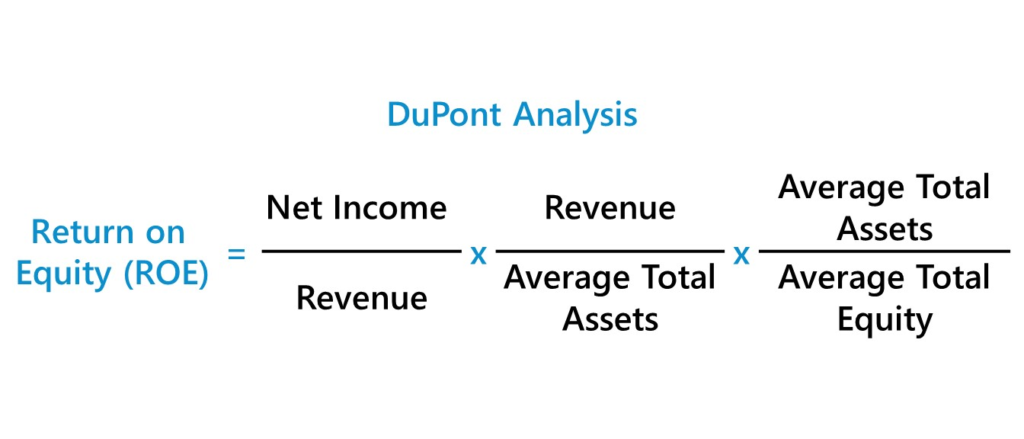
This approach provides a more detailed analysis by showing how profitability, operational efficiency, and leverage all contribute to ROE. It’s particularly useful for identifying whether a company’s ROE is driven by its core operations or by the way it utilizes its assets or is increasing its financial leverage.
Components of The DuPont Analysis
- Net Profit Margin - The core of a company’s value lies in its ability to generate profits. Investors assess both historical earnings and future earnings potential to understand the company’s profitability. A consistent track record of earnings growth often signals a healthy business. The Net Profit Margin is the ratio of net income to revenue, and it measures how much profit is generated from each unit of sales. A higher net profit margin indicates that the company is efficient in controlling its costs and is capable of converting sales into actual profit. Factors influencing the net profit margin include pricing strategy, cost structure, and operational efficiency.
- Asset Turnover - The second component, Asset Turnover measures how effectively a company utilizes its assets to generate sales. A higher asset turnover ratio indicates that the company is efficiently using its assets to produce revenue i.e. it is generating more revenues with fewer assets. This ratio is particularly important for asset-heavy industries where maximizing the use of physical or capital assets is critical to profitability. The first two components, net margin and Total Asset Turnover, represent measures of operating efficiency and the asset utilization efficiency of the business.
- Equity Multiplier - The Equity Multiplier reflects the total amount of debt used in the company’s capital structure. It is calculated by dividing total assets by shareholders’ equity. A higher equity multiplier indicates higher financial leverage, meaning the company relies more on debt to finance its assets. The greater the reliance on debt financing, the higher the periodic interest expense owed to the lender, which causes the risk of default to rise. However, interest expense is tax deductible, forming a "tax shield" that reduces taxable income (PBT). While leveraging can boost ROE, it also introduces more risk, especially in volatile markets.
The Five - Step DuPont Approach
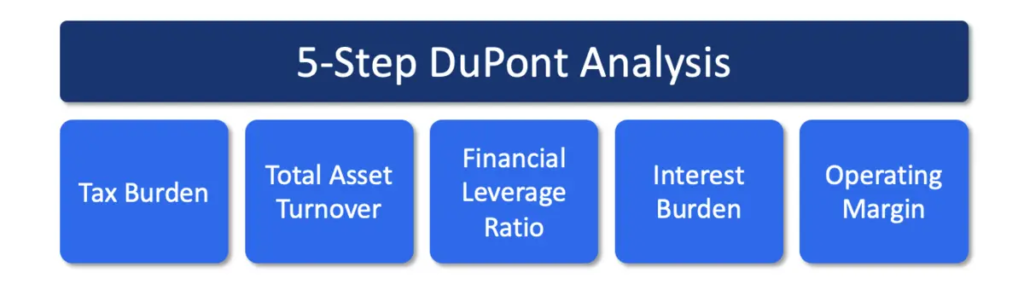
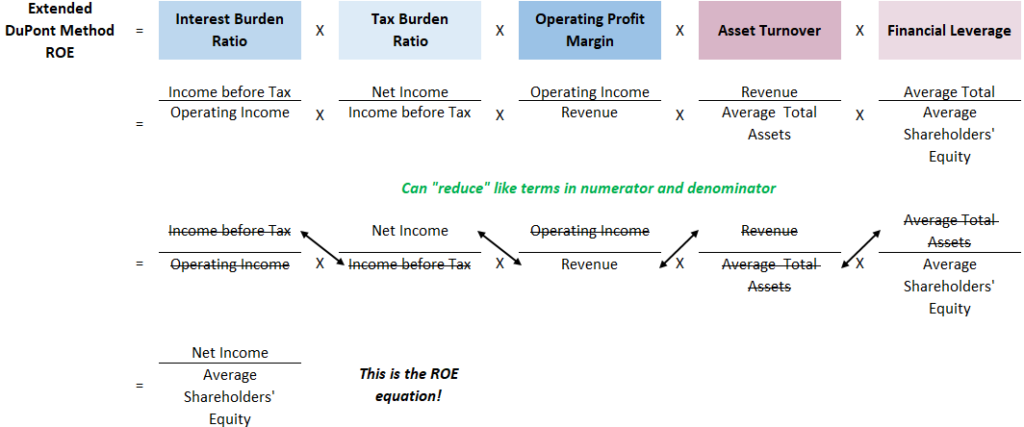
The basic DuPont Analysis model does not isolate the operating activities from the financing activities. This was obvious from our observation regarding the relationship between leverage and profit margin. For a deeper dive into financial performance, the 5-step DuPont Analysis breaks down the components even further:
- Tax Burden:
Tax Burden is calculated as Net Income divided by Earnings Before Taxes (EBT). It shows the percentage of EBT that the company retains after paying taxes. A lower tax burden means the company is paying higher taxes, which reduces the ROE.


Comments
Log in to comment and join the discussion.
No comments yet. Be the first to comment.