

Research By: Saizal Agarwal
The capital asset pricing model (CAPM) is a financial model that determines the expected rate of return on an asset or investment.
Basically, it estimates expected return of an investment based on its riskiness relative to the rest of the market by calculating the expected return on both the market and a risk-free asset, as well as the asset’s correlation or sensitivity to the market (beta).
Calculation
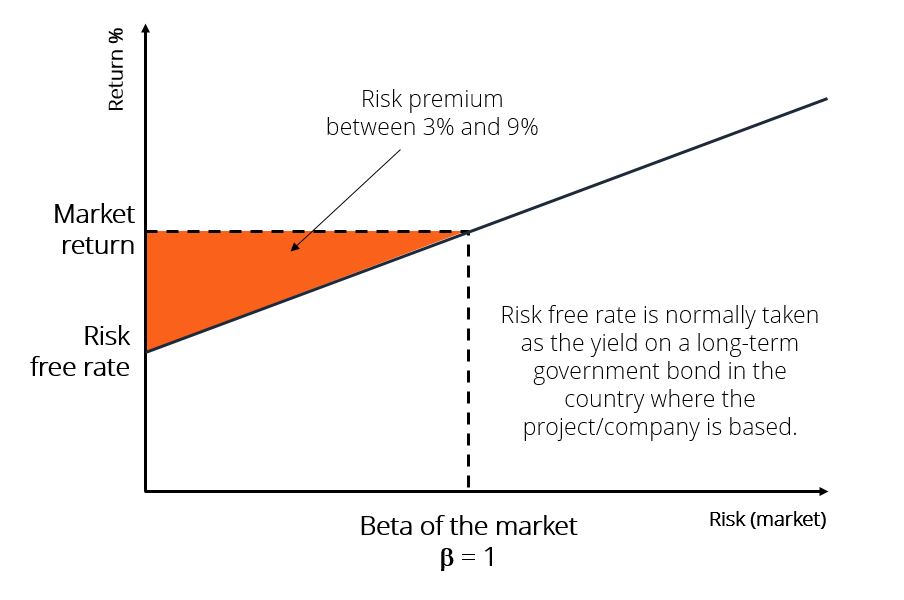
ERi = Rf + βi (ERm – Rf)
where,
ERi = Expected return of investment
Rf = Risk-free rate
βi = Beta of the investment
(ERm – Rf) = Market Risk Premium
The risk-free rate in the CAPM calculation represents the time value of money. The remaining components of the CAPM formula account for the investor’s added risk.
Goal
The CAPM formula seeks to determine if a stock is properly valued by comparing its risk and time value of money to its predicted return. In other words, by understanding the separate components of the CAPM, it is feasible to determine whether a stock’s present price is compatible with its expected return.
Expected Return of investment: It is a long-term assumption about how an investment will perform over its entire life.
Risk Free rate: It is usually equal to the yield on a 10-year government bond because government is usually has a very low likelihood of defaulting on their debt obligations. The risk-free rate should be appropriate for the country in which the investment is made, and the bond’s maturity should meet the investment’s time horizon. Professional tradition, however, is to always utilize the 10-year rate because it is the most heavily quoted and liquid bond.
Beta: It is a measure of how much a stock’s price moves in relation to the overall market. Beta tells us how sensitive a particular stock is to the market’s movements. If a stock has a beta of 1, it means the stock tends to move in line with the market. So, if the market goes up by 10%, the stock is also likely to go up by 10%. If the market goes down by 10%, the stock is likely to go down by 10%.
Higher beta means higher volatility and lower beta means lower volatility which means if a stock has a beta of 1.5 means that if the market goes up by 10%, the stock is likely to go up by 15%. Conversely, , if a stock has a beta 0.5 means that if the market goes up by 10%, the stock might only go up by 5%.
Some stocks can have a negative beta, meaning they move in the opposite direction to the market. For example, a beta of -1 means that if the market goes up by 10%, the stock might go down by 10%, and vice versa.
Market Risk Premium: The extra return over the risk-free rate that investors must get in exchange for their investment in a riskier asset class is known as the market risk premium. Also, the market risk premium will increase with market or asset class volatility.
Assumptions made by the CAPM
- All investors are risk-averse by nature.
- Investors have the same time period to evaluate information.
- There is unlimited capital to borrow at the risk-free rate of return.
- Investments can be divided into unlimited pieces and sizes.
- There are no taxes, inflation, or transaction costs.
- Risk and return are linearly related.
Example
Let’s go through an example of calculating the expected return using the CAPM for an Indian company. We’ll use Reliance Industries Limited (RIL) as an example.
Step-by-Step Calculation:
1. Risk free Rate (Rf)
The risk-free rate in India is usually taken as the yield on the 10-year Government of India bond. Suppose the current yield on the 10-year government bond is 7%.
2. Beta (β) of Reliance Industries
Beta is a measure of how much the stock moves relative to the market. Assume the beta for Reliance Industries is 1.2. This information is typically available on financial data platforms.
3. Market Return (Rm)
The market return is the expected return of the broader market. For India, this can be represented by the return of the Nifty 50 or BSE Sensex index. Suppose the expected return of the market is 12%.
4. Market Risk Premium (Rm – Rf)
The market risk premium is the difference between the market return and the risk-free rate:
Market Risk Premium = Rm – Rf = 12% – 7% = 5%
5. CAPM Formula
Expected Return = Rf + βi (Rm – Rf)
Substituting the values:
Expected Return = 7% + 1.2 x 5%
= 7% + 6% = 13%
Interpretation
- The expected return on Reliance Industries’ stock, according to the CAPM, is 13%.
- This means that investors would expect a return of 13% from investing in Reliance Industries, considering the risk (as measured by beta) and the return available from a risk-free investment (like a government bond).
Real-World Context:
Decision-Making: If the actual expected return based on market analysis or analyst reports is higher than 13%, Reliance Industries might be considered a good investment. Conversely, if the expected return is lower than 13%, it might be overvalued.
Limitations of CAPM model
- Unrealistic Assumptions:
- Market Efficiency: The CAPM makes unrealistic assumptions about market efficiency, which implies that asset prices accurately reflect all relevant information. Prices can be affected by a variety of factors, including behavioral biases and information asymmetries, and the markets may not always be completely efficient.
- Homogenous Expectations: All investors are assumed to have identical assumptions regarding future risks and returns by the model. Diverse perspectives and approaches among investors may result in differences in expectations.
- Risk-free rate Assumption: The basis of the CAPM formula is the risk-free rate. The genuine risk-free rate, however, may not necessarily be reflected in the choice of risk-free rate, which is usually represented by government bond rates. Furthermore, figuring out the risk-free rate could get harder during uncertain economic times.
- Single component model:
To explain asset returns, the CAPM model depends on a single systematic risk factor (beta). It does not take into consideration other variables that could affect returns, such as credit risk, liquidity issues, or other macroeconomic factors. The intricacy of actual markets may be oversimplified by this simplicity.
- Static Beta:
CAMP makes the assumption that an asset’s beta will not change over time. In actuality, variations in a company’s business operations, the state of the market, or other external factors can cause beta to fluctuate. This may cause people to estimate expected returns incorrectly.
- Ignores taxes and transaction expenses:
CAMP does not take into consideration capital gains taxes or the transaction costs related to purchasing and selling assets. In reality, an investor’s actual return may be considerably impacted by these expenses.
- Behavioral Elements:
The CAPM makes the logical assumption that investors are risk-averse. Investment decisions might be influenced by behavioral biases and emotional elements like greed and fear, which the model might not be able to fully account for.
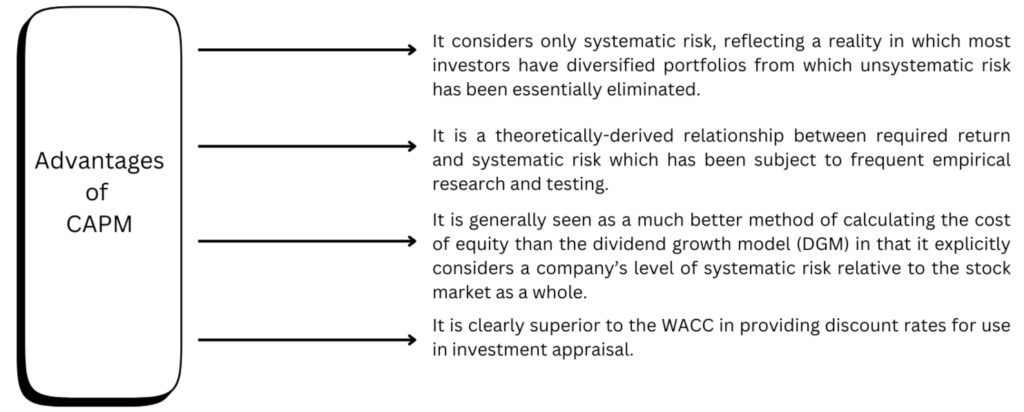
How may investors benefit from CAPM?
- Measuring and quantifying systematic risk:
By utilizing the beta coefficient, CAPM assists investors in measuring and quantifying systematic risk. This makes it possible to evaluate an asset’s risk in connection to the market as a whole in a methodical and consistent manner, which helps with risk management techniques.
- Establishing a baseline for expected returns:
The Capital Asset Pricing Model (CAPM) offers a technique for calculating the expected return on an investment, which serves as a benchmark for investors to evaluate the possible return of a certain asset. This comparison makes it easier to assess if the investment’s degree of risk is justified by the predicted profits.
- Supporting portfolio management:
When it comes to portfolio management, CAPM is helpful. By choosing an asset mix that together meet their risk tolerance and return goals, it enables investors to optimize their portfolios. The approach assists in building diversified portfolios that strike a balance between return and risk.
- Consistency and Communication:
CAMP offers a uniform vocabulary for analyzing and debating the risk and return aspects of investments. Maintaining consistency in communication is beneficial for investors, analysts, and other stakeholders as it promotes a common understanding of the elements that impact investment decision
- Market Comparison:
It enables investors to assess the projected returns of various assets in relation to the overall market. Making informed investment decisions and determining if the risk and return profile of an asset is consistent with the state of the market need the use of this information.
In summary, although the Capital Asset Pricing Model (CAPM) has its drawbacks and detractors, its advantages in offering a methodical and organized way to evaluate the risk-return profile of assets make it an important instrument in the financial toolbox. In order to evaluate investment opportunities more thoroughly, investors might combine the CAPM with other models and aspects as part of a larger analytical framework.