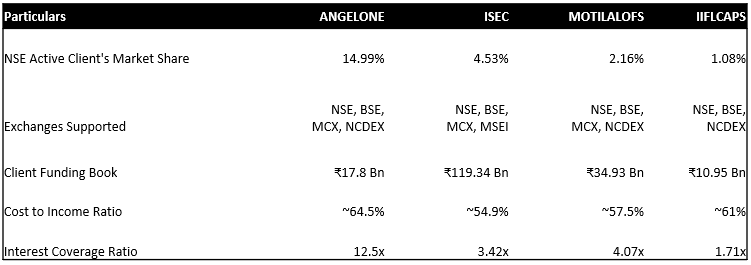
ANGELONE’s top peers are ICICI Securities Ltd. (ISEC), Motilal Oswal Financial Services Ltd. (MOTILALOFS) and IIFL Capital Services Ltd. (IIFLCAPS).
Comparison of company’s key metrics with top peers

ANGELONE holds a market share of 14.99% in the NSE Active Client base ranking it third highest in the online discount broking segment, significantly outperforming its competitors. While ISEC, MOTILALOFS, and IIFLCAPS had a market share of 4.53%, 2.16%, and 1.08%, ANGELONE had almost 2x of that combined. This shows the company’s clear dominance in terms of active NSE clients, which, with ANGELONE’s healthy customer acquisition and retention rate, is set to increase even further due to the increase in retail activity in the capital markets. Moreover, the company provides services across NSE, BSE, MCS, and NCDEX, attracting customers who desire to trade through different exchanges.
The company’s client funding book lagged behind competitors like ISEC and MOTILALOFS, whose books amounted to ₹119.34 billion and ₹34.93 billion. Although ANGELONE’s client funding book was higher than that of IIFLCAPS’s book, which totaled ₹10.95 billion, the company’s performance in this sector was comparatively less than that of its peers. The company’s client funding book amounted to ₹17.8 billion at the end of FY24, growing by only 7.9% YoY.
ANGELONE has the highest cost-to-income ratio, which equals about 64.5%, as compared to its competitors whose cost-to-income ratios range from 54% to 61%. This indicates that the company has some improvements to work in terms of operational efficiency to decrease its cost-to-income ratio and stay aligned with its competitors to remain a leading company in the industry.
Lastly, the company’s interest coverage ratio majorly surpassed its competitors with a number of 12.2x. The company’s peers, ISEC, MOTILALOFS, and IIFLCAPS had ratios of 3.42x, 4.07x, and 1.71x, indicating that ANGELONE has more than enough funds to comfortability take care of its interest expenses and does not have to rely on any contingent plans. However, in some cases, an extremely high-interest coverage ratio might suggest that the company is not efficiently employing debt securities.
Operating Profit Margin Growth (%)

After decreasing in FY20, ANGELONE’s operating profit margin growth rate increased for three year, but in FY24 the margin growth declined to -6.98% indicating a decrease in operatiooperationalnally efficiency.
In comparison, ISEC showed impressive stability in its operating growth through the years, ending with an increase of 8.06% in FY24, as opposed to IIFLCAPS, whose operating margin saw a majority decline but finally increased by a healthy 20% in FY24.
Next, MOTILALOFS showed a decrease in three years, but the two years it experienced positive growth showed an exceptional increase of 64.71% in FY21 and a recent 28.89% increase in FY24.
Debt to Equity (times)

MOTILALOFS has had the most stable debt-to-equity ratio from FY20 to FY24, ranging from 1.08x to 1.6x, representing consistent funding from both debt securities and equity capital. Moreover, the ratio also suggests an increase in debt compared to equity, indicating a potential increase in value for shareholders.
On the other hand, IIFLCAPS’s debt-to-equity ratio ranged from 0.3x to ending with 0.65x, representing a conservative approach regarding leverage position. Although, a conservative approach might be assuring but could indicate inefficient use of debt securities.
As with ANGELONE, it has also remained around the same scale as IIFLCAPS, its ratio ranging from 0.36x to 1.04x. The company ended FY24 with a debt-to-equity ratio of 0.83x, indicating a comparatively steady position regarding leverage. Again, a conservative leverage position can be seen as a positive but still has some risks attached to it.
Meanwhile, ISEC’s ratio rose from about 1.25x in FY20 to 4.25x in FY24, suggesting a high reliance on debt securities as opposed to equity, which might result in an increase in financial risk.
Current Ratio (times)

ANGELONE’s current ratio equaled 1.25x in FY24 from 1.31x in FY20, representing extreme stability in the company’s healthy ability to pay off its current liabilities. IIFLCAPS also maintained a stable current ratio at 1.22x, mirroring ANGELONE’s position of having a comfortable ability to pay off short-term liabilities.
MOTILALOFS had a solid current ratio of 2.22x, maintaining an extremely secure stance regarding its short-term liquidity positions. On the other hand, ISEC’s current ratio dropped drastically from 3.56x in FY20 to 1.37x in FY21 and then finally stopped at 1.18x in FY24. This might relate to solvency issues if this ratio continues to deplete even lower.
ROCE (%)

ANGELONE’s return on capital employed has been gradually increasing through the years and was the best among its peers from FY22 to FY25. This shows that the company’s profitability is increasing in relation to the capital employed more than its competitors, highlighting ANGELONE’s efficiency.
Next, ISEC and IIFLCAPS both had stable percentages, but as IIFLCAPS’s ROCE increased, ISEC’s ROCE decreased, indicating inefficient use of the company’s capital employed by ISEC during these years.
Lastly, MOTILALOFS had the lowest percentages each year, which might relate to low financial efficiency by the company and not matching the growth in EBIT with the increase in capital employed.
EPS Growth (%)

The percentage growth of EPS of ANGELONE showed stability relating to its peers. Starting off with a growth of just 3.16% in FY20, it peaked in FY22 with a growth rate of 107.86% and finally, in FY24 the rate was at 25.59%. This represents decent growth for the company through the years.
MOTILALOFS exhibited an outlier in this comparison with a growth rate of 593.23% in FY21 and ended with a rate of 160.23% in FY24, while experiencing a negative growth rate in FY20 and FY23, indicating higa h level of volatility. Meanwhile, IIFLCAPS also showed high volatility through the years, but it ended with a rate of 103.17%, which might relate to immense growth in operational performance.
ISEC showed a consistent growth rate, peaking in FY21 at 97.03% and then ending at 51.56% in FY24.


