NSE: BANKBARODA
Balance Sheet
1. Asset Growth and Transformation
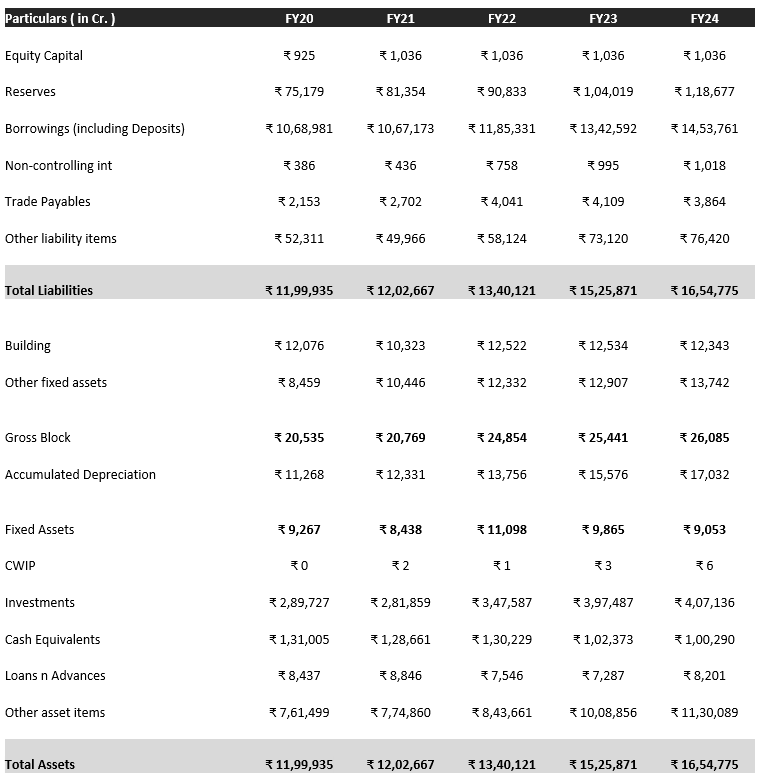
Consistent asset growth, with total assets increasing from ₹12.8 lakh crore in FY21 to ₹17.1 lakh crore in FY24, showcasing its expansion strategy. The loan portfolio has seen a significant shift, with retail loans growing by 20.7% in FY24 to ₹2.15 lakh crore, aiming for a mix of 65% non-corporate and 35% corporate loans in the medium term. The bank has prioritized mid-corporate lending through specialized branches. International operations have focused on balanced growth, contributing around 15% to the overall business in FY24, aligning global opportunities with domestic strategies. Domestic investments reached ₹3.57 lakh crore in FY24, with improved strategic management strengthening SLR compliance and capital adequacy.
2. Funding and Capital Strength
On the funding front, global deposits grew to ₹13.27 lakh crore in FY24, with a strong emphasis on CASA to optimize funding costs. The bank maintained a capital adequacy ratio (CAR) above 16%, relying on internal accruals for growth and planning to raise ₹2,000 crore via bonds for liquidity management.
3. Asset Quality and Provisions
BoB (BoB) has consistently improved its asset quality over the past four years, driven by proactive management and strategic measures. The Gross NPA ratio declined from 8.87% in FY21 to a multi-year low of 2.92% in FY24, while the Net NPA ratio improved from 3.09% in FY21 to 0.68% in FY24. These improvements were supported by declining slippage ratios and record-low credit costs, which fell to 0.53% in FY23. BoB’s provisioning practices strengthened its Provision Coverage Ratio (PCR) from 81.80% in FY21 to 93.30% in FY24, ensuring resilience against potential risks.
The bank’s shift towards retail lending, known for lower NPAs, has been instrumental in enhancing asset quality. BoB also adopted conservative provisioning practices, such as maintaining 20% provisions on secured sub-standard advances (above the regulatory requirement) and 100% provisions on certain retail NPAs, further fortifying its financial position. Additionally, efficient recovery and upgrade efforts, supported by a dedicated Risk Asset Management vertical, have played a critical role in improving asset quality.
4. Profitability and Efficiency
Profitability metrics remained strong, with net interest income (NII) reaching ₹44,722 crore in FY24, supported by loan growth and stable net interest margins (NIM) of around 3.15%. The bank achieved sustained ROA above 1% and ROE above 16%, meeting targets ahead of schedule, while maintaining cost efficiency with a stable cost-to-income ratio.
5. Future Outlook
Loan growth is expected to moderate to 11–13% in FY25 to sustain healthy margins and credit quality, with a greater focus on deposit mobilization amid slower credit expansion. Challenges include managing NIM in a fluctuating interest rate environment and addressing global uncertainties in international operations. Long-term growth will be driven by retail and mid-corporate lending, technology investments, and enhanced customer service.
Income Statement
1. Non-Interest Income and Strategic Initiatives
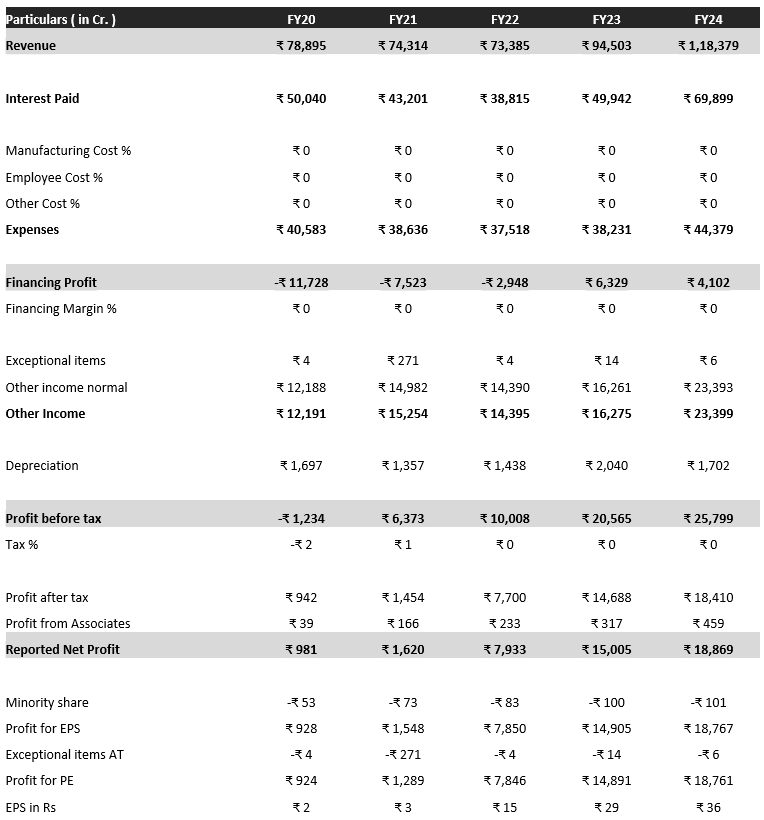
BoB’s non-interest income rebounded to ₹14,495 crore in FY24, up from ₹10,025 crore in FY23, driven by improved treasury income, fee income, and recoveries. Initiatives like “BOB-NOWW” boosted fee income by 15%, while the Wealth Management SBU achieved 44% growth in mutual fund AUM and 45% in life insurance premiums. The “Fees and Flows” strategy and investments in digital transformation have enhanced fee-based revenue and customer experience. BoB’s focus on wealth management, digitalization, and fee income stability supports long-term growth.
2. Operating Expenses and Efficiency
BoB’s operating expenses rose steadily, reaching ₹28,251 crore in FY24, a 15.2% increase driven by wage settlements, pension liabilities, and inflation. Despite rising costs, the cost-to-income ratio improved from 49.24% in FY22 to 47.72% in FY23 and remained stable at 47.71% in FY24, supported by strong earnings growth and cost management. BoB’s focus on cost optimization, process streamlining, and technology adoption has maintained operational efficiency amid increasing employee costs.
3. Growth in Retail Mix to Enhance Margins and Reduce Business Cyclicality
BoB’s historical underperformance compared to peers has primarily stemmed from defaults in its large corporate loan portfolio. Corporate lending, being inherently cyclical, exposed the bank to weaker asset quality during economic downturns, leading to elevated credit costs, profitability erosion, and constrained growth potential. To mitigate this, BoB is increasingly shifting its focus toward expanding the retail loan mix while reducing its reliance on corporate lending. This strategic shift is expected to make the bank’s loan book more resilient to economic cycles and sustain long-term growth momentum. We project loan book growth of 14.7% CAGR over FY23-26E, with the retail loan mix rising from 22% in FY23 to 25% in FY26E.
4. NIMs to Remain Above 3% Despite Moderation
BoB reported its highest-ever NIM of 3.31% in FY23, benefiting from a favorable interest rate environment. With interest rates expected to remain stable in the near term and a potential rate cut anticipated in the latter half of FY24, NIMs are likely to moderate from their peak. However, BoB’s focus on changing its advances mix toward higher-yielding retail loans and maintaining control over its cost of funds should limit the decline. We estimate NIMs to stabilize at 3.2% in FY24E and remain at 3.1% for FY25E and FY26E.
5. Profitability Outlook
The structural shift in the loan mix, combined with a stable cost-to-income ratio as BoB expands its retail business, is expected to drive continued improvement in profitability. We forecast a 9.6% CAGR in PAT over FY23-26E, building on BoB’s highest-ever PAT of ₹14,109 crore in FY23. This demonstrates the bank’s ability to balance growth and cost efficiency while maintaining healthy margins.
Cash Flow Statement
1.Operating Cash Flow
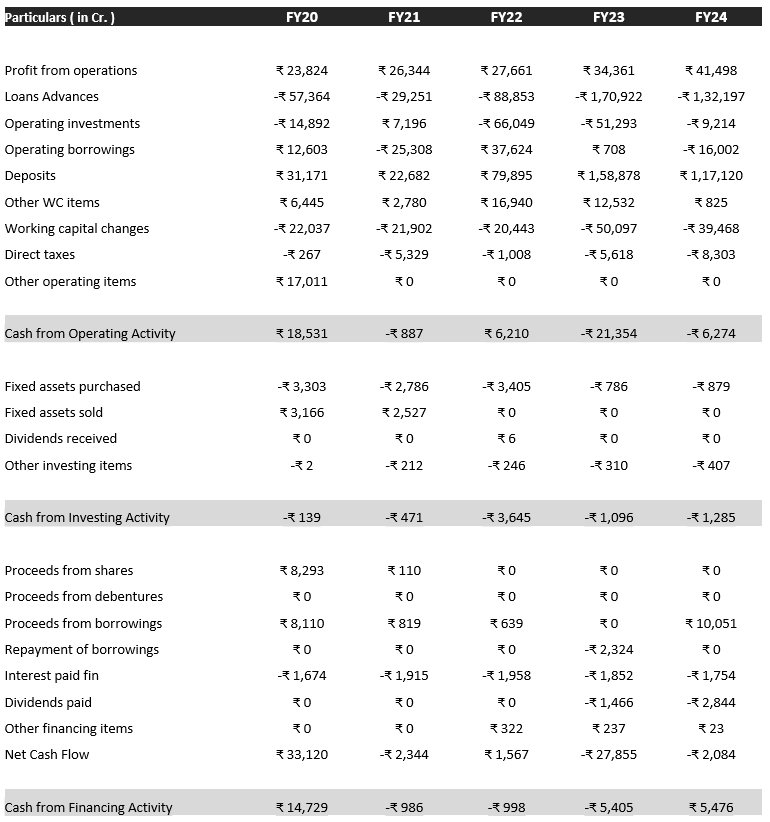
BoB consistently generated operating cash inflows, reflecting strong core profitability and operational efficiency. Net cash inflows from operating activities were ₹3,267.15 crore in FY21, driven by strong income and lower provisions, moderating to ₹1,498.04 crore in FY22 as income growth outpaced expenses. In FY23 and FY24, inflows remained healthy at ₹1,389.34 crore and ₹1,386.12 crore, respectively, supported by growth in interest income, particularly from the retail loan portfolio.These trends highlight BoB’s effective asset-liability management, cost control, and focus on sustainable growth. The strong operating cash flows provide a foundation for reinvestment in strategic initiatives, technology, and business expansion, strengthening the bank’s long-term competitiveness.
2. Investing Cash Flow
BoB’s investing activities consistently resulted in net cash outflows, reflecting its strategic focus on expanding its investment portfolio and supporting credit growth. Outflows increased from ₹2,688 crore in FY21 to ₹4,713.9 crore in FY22, driven by higher investments. In FY23, outflows moderated to ₹1,945.2 crore, while FY24 saw an outflow of ₹3,088.6 crore, primarily due to growth in loans and advances and continued portfolio expansion.These trends highlight BoB’s commitment to building a investment portfolio, leveraging market opportunities, and focusing on credit expansion in retail and MSME segments. Its cash flows reflect a strategic balance between lending and investment activities, aligning with market dynamics and growth objectives.
3. Financing Cash Flow
BoB has actively managed its financing cash flows to maintain a strong capital base and support growth. In FY21, it recorded a net inflow of ₹147.29 crore, driven by QIP proceeds (₹4,500 crore) and AT-I bonds issuance (₹3,735 crore). FY22 saw a net outflow of ₹99.78 crore, mainly due to bond redemptions, though capital adequacy remained strong at 15.84%. In FY23, a significant outflow of ₹548.84 crore resulted from bond redemptions and dividend payments, partially offset by AT-I bonds worth ₹2,474 crore. FY24 marked a net inflow of ₹545.24 crore, supported by subordinated bond issuance (₹1,005.06 crore), with the book value per share rising to ₹181.48.BoB’s strategic use of instruments like QIPs and bonds, consistent dividend payouts, and effective debt management highlight its focus on optimizing cash flows, supporting growth, and enhancing shareholder value.
3. Cash and Cash Equivalents
BoB consistently held over ₹1,20,00,000 lakh in cash equivalents across FY21-FY24, ensuring operational flexibility and growth readiness. BoB’s fluctuating cash and cash equivalents reflect active liquidity management, balancing lending, investments, and operational needs. Recent loan growth in FY23 and FY24 likely contributed to reduced liquidity as funds were deployed for credit expansion. Additionally, the bank’s investment portfolio growth suggests a strategic allocation of liquid assets to optimize returns. Declining liquidity trends may also be influenced by tightening market conditions and interest rate changes. Ensuring adequate liquidity for operational needs and regulatory requirements remains a critical focus for the bank.


