

NSE: IDFCFIRSTB
⮚ Retail banking:
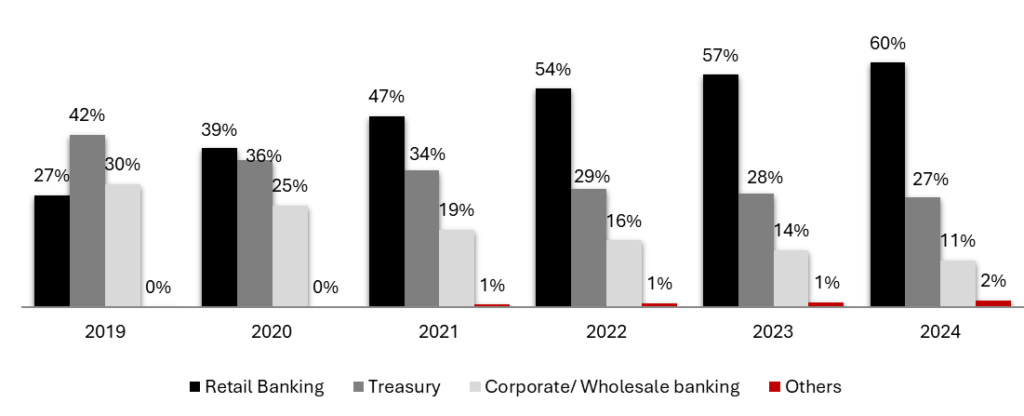
• It is the highest revenue generating segment with a contribution of around 59.95% among all the segments. It constitutes lending to individuals / business banking customers through the branch network and other delivery channels subject to the orientation, nature of product, granularity of the exposure and the quantum thereof.
• Revenues of the retail banking segment are derived from interest earned on retail loans, inter segment revenue and fees from services rendered, fees on client FX & derivative
• Expenses of this segment primarily comprise interest expense on deposits and funds borrowed from inter segments, commission paid to retail assets sales agents, infrastructure and premises expenses for operating the branch network and other delivery channels, personnel costs, other direct overheads and allocated and support groups. This also includes digital banking products acquired by Digital Banking Units (DBUs). As of March 31, 2024, IDFC FIRST Bank’s market share is 1.20% of total bank credit which improved from 1.13% last year.
⮚Treasury:
• This contributes to around 26.93% revenue of the bank.
• The treasury segment primarily consists of Bank’s investment portfolio, money market borrowing and lending, investment operations and foreign exchange and derivative portfolio of the Bank.
• Revenue of treasury segment consist of interest income on investment portfolio, inter segment revenue, gains or losses from trading operations, trades and capital market deals.
• The principal expenses consists of interest expenses from external sources and on funds borrowed from inter segments, premises expenses, personnel cost, direct and allocated overheads.
⮚Corporate/ Wholesale Banking:
• This contributes 11.47% of the total revenue generated by bank. The wholesale banking segment provides loans, non-fund facilities, loan syndication and transaction services to corporate relationship not included under Retail Banking.
• Revenues of the wholesale banking segment consists of interest earned on loans to customers, inter segment revenue, interest / fees earned on transaction services, earnings from trade services, fees on client FX & derivative and other non-fund facilities.
• The principal expenses of the segment consists of interest expense on funds borrowed from internal segments, premises expenses, personnel costs, other direct overheads and allocated expenses of delivery channels, and support groups.
⮚Others/ Unallocated:
•This is very less focused segment and small contributor to the revenue of the bank of around 1.65%.
• This segment includes revenue from distribution of third party products or all items which are reckoned at an enterprise level are classified under this segment. This includes assets and liabilities which are not directly attributable to any segment.
• Revenue and expense of this segment includes income and expenditure which are not directly attributable to any of the above segments. Revenue includes interest on income tax refund and expense of this segment mainly includes employee cost, establishment & technology expense which is not directly attributable to any segment.
Exhibit 1: Shift in trend from treasury & corporate/ wholesale banking with 42% & 30% revenue in FY 19 to turning out retail banking as the highest revenue contributor with 60% in FY24
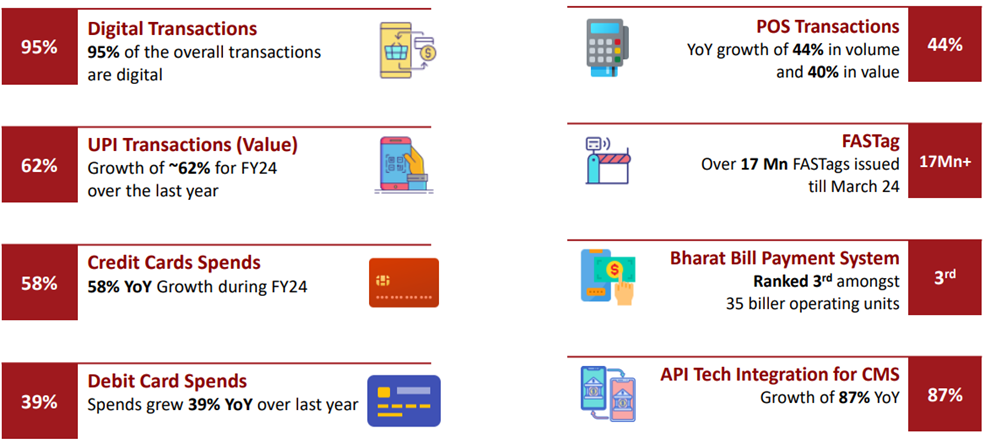
Digital Initiatives (Significant Traction on Electronic Platforms)
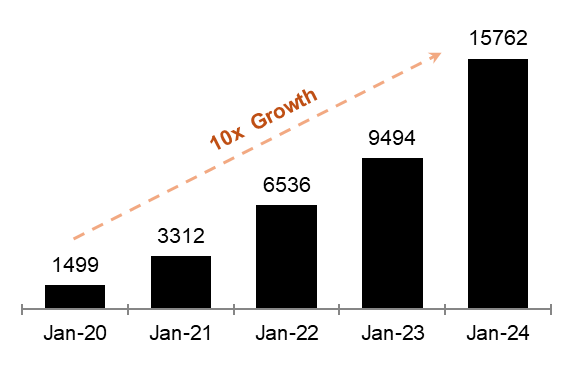
Highly Successful Launch of Wealth Management Business
•The Bank has created strong capabilities and wholistic customer propositions in Wealth Management and has grown the Wealth Management AUM from scratch to Rs. 15,762 crore in the last 5 years after merger. In FY24, the Wealth Management AUM grew by 66% YOY.
• It includes PMS, AIF Investments, Bonds & Structured Products, Pre Listed & Pre IPO Equity Funds, Estate & Trust Planning services, Loan against securities & IPO, Offshore & Immigration Linked Investments.
Exhibit 2: Wealth Management Business shows 10x growth in just 4 years
Source: Investor Presentation Q4 FY24
Cost Structure
• Expenditure on Interest around Rs. 10 Cr in which major part is of interest on deposits, others and then interest on borrowings from RBI/ Inter bank borrowings). It shows an increase of around 355 compared to last year.
• Operating expenses are around Rs. 12 cr. It shows an increase of around 25% compared to last year.
• Voluntary CSR Expenditure Rs.50cr over last 3 years.
Exhibit 2: Strong Growth with CAGR (5Y): 37% in Total Customer Deposits (in INR)
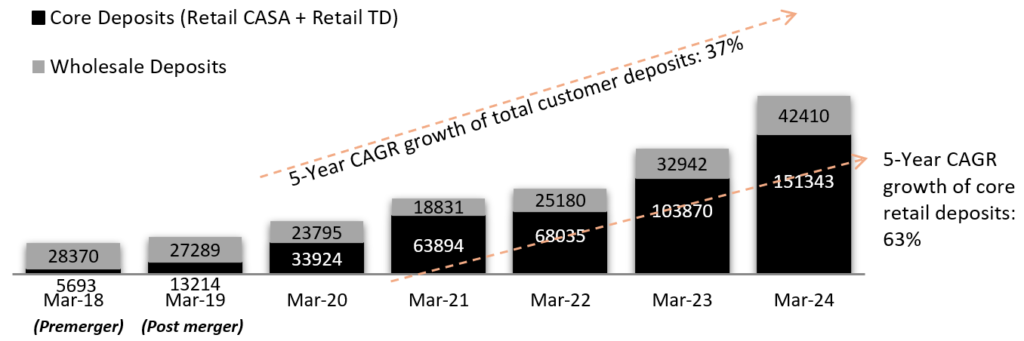
Source: Investor Presentation Q4 FY24
• The Bank has built strong capabilities to consistently grow its Deposit Franchisee. Some of the key factors responsible:
• IDFC first bank is seen as an ‘Institution’
• High focus on customer service
• Customer friendly and attractive product propositions & strong digital capabilities
Exhibit 3: The Bank has demonstrated the capability to grow CASA Deposits with CAGR (5Y):64%
(in INR)
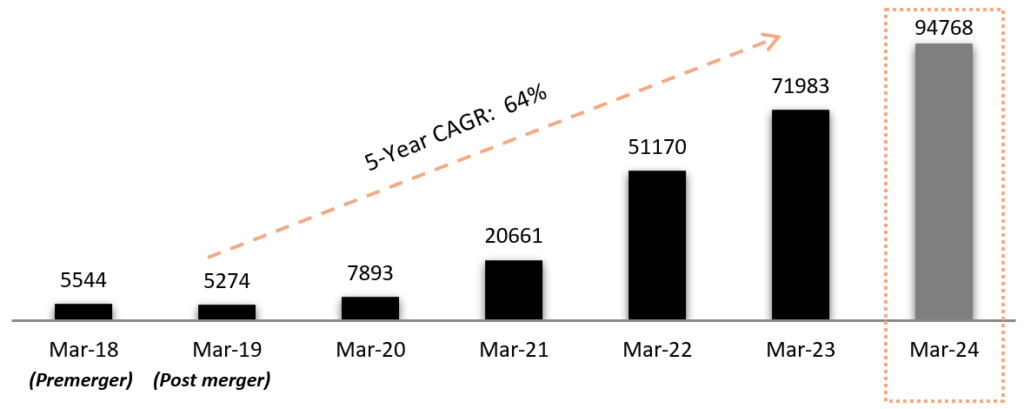
Source: Investor Presentation Q4 FY24
• The bank has reduced interest rates on savings account to only 3% for balances upto Rs. 1 lac.
• The CASA deposit growth continues to be strong, growth of 32% YOY as of March 31, 2024, driven by the granular retail CASA.
• Deposits of 31st March 2024 includes Rs. 2,812 crore (March-23 Rs. 2,131 crore) of Current Account Deposits received for short term from a large Government Banking client, excluding this CASA deposits grew 32% YoY.
Exhibit 4: Healthy CASA Ratio at 47.2%

Source: Investor Presentation Q4 FY24
• CASA Ratio stable at 47.2% as of March 31, 2024.
• Average Daily Balance CASA Deposits for the bank grew by 28% YoY during the year.
• Excluding the one-time short-term flow from a government banking client, CASA ratio as on March 31, 2024, would be 46.5%. Excluding the same for March-23 the CASA ratio was 49.0%.
Exhibit 5: Transformation of the liability portfolio by incrementally replacing the institutional borrowings & deposits by granular retail deposits
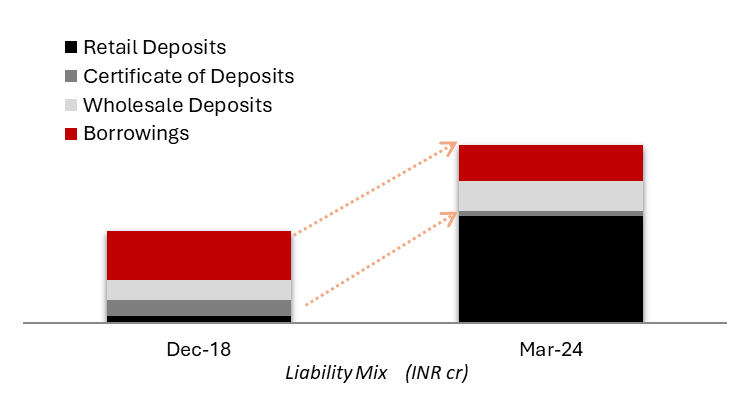
Source: Investor Presentation Q4 FY24
• Retail Deposits were only 8% of the total deposits & borrowings as of December 31, 2018.
• The Bank incrementally mobilized Rs. 140,943 crore of retail deposits in the last 5 years and reduced dependency on institutional deposits & borrowings.
• As a result, Retail Deposits as % of total deposits and borrowings now improved to 60% as of March 31, 2024.
Diversification of Deposits
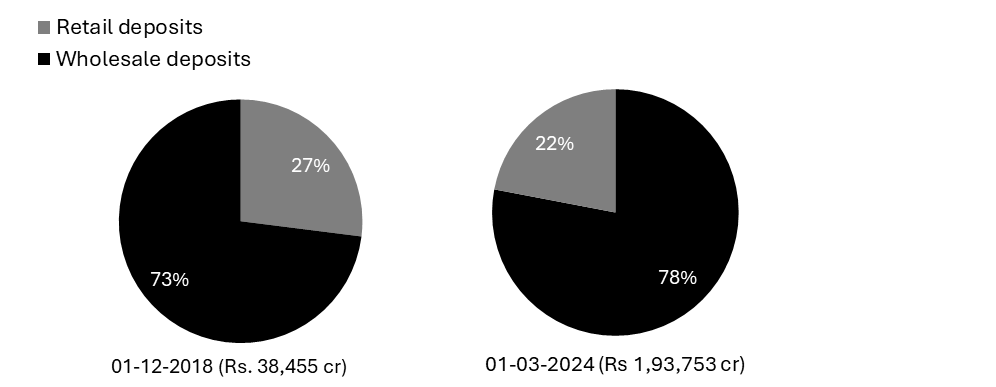
Source: Investor Presentation Q4 FY24
• It is a strategic priority of the Bank to diversify the liability in favour of retail deposits to stabilize and improve the sustainability of the balance sheet.
• The Bank has transformed the liability profile in 5 years from wholesale to retail, in order to diversify the deposit base.
• Strong growth of 46% YoY in retail deposits has significantly reduced dependency of the Bank on the wholesale deposits.
Legacy High Cost Borrowings
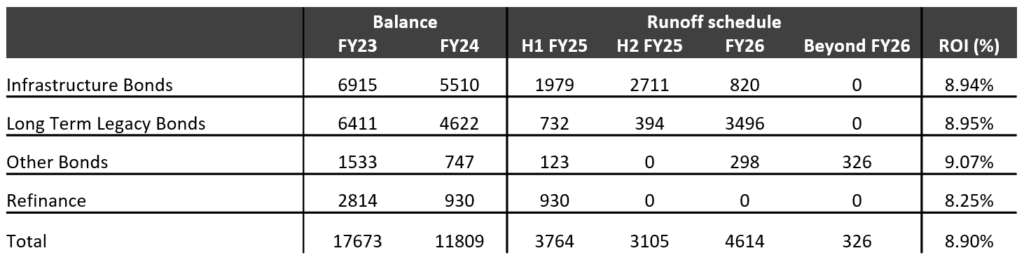
• The bank continues to successfully run down the legacy high-cost long-term borrowings.
• Because the bank has a DFI background, the legacy borrowings are costing the bank 8.90%. The bank plans to replace this with low-cost deposits.
• To simulate, if the bank had replaced all high-cost legacy borrowings with the cost of funds, the ROI for FY 24 would be higher by ~95 bps.
Diversified Loan Book (Across 25 Business Lines)
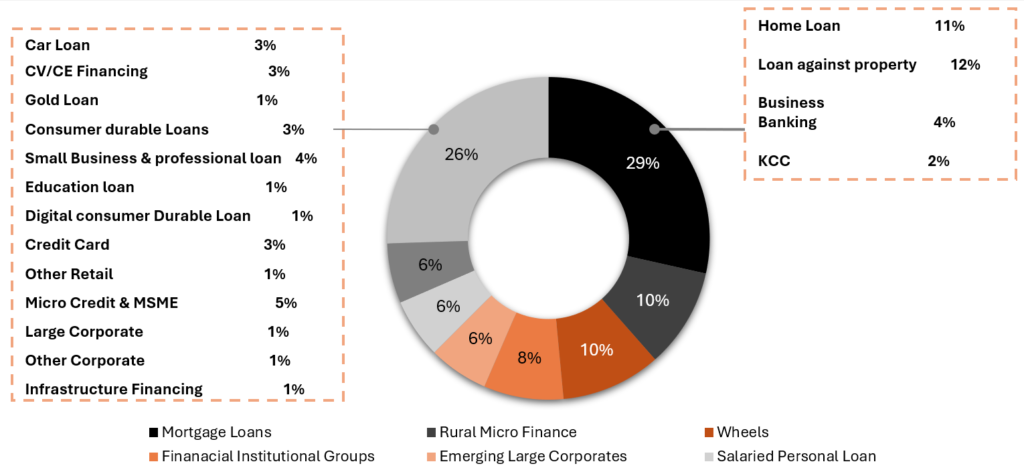
Source: Investor Presentation Q4 FY24
Exhibit 6: Incremental Credit Deposit Ratio

Source: Investor Presentation Q4 FY24
• The credit-deposit ratio has improved consistently from 137% to 98.4% since the merger and will improve as the Bank continues to grow deposits.
• At the time of merger, the bank had high Credit to Deposit ratio (CD ratio) because it was largely funded with bonds & borrowings. Bonds and borrowings are equally stable money as deposits, as they are repayable only on maturity dates.
• The bank has been continuously raising more deposits than loans disbursed on an incremental basis which is continuously reducing the CD ratio.
Exhibit 7: High Retail Asset Quality (GNPA of 2% & NNPA of 1% across cycles

Source: Investor Presentation Q4 FY24
• In the Retail, Rural & SME Finance portfolio, GNPA and NNPA have come down to 1.38% and 0.44% respectively.
• Also, asset quality was maintained even during IL&FS (Infrastructure Leasing & Financial Services Limited), Crisis, Covid-19 etc.
Exhibit 8: SMI-1 & SMI-2 portfolio as % of total Retail, Rural & SME Loan Book

Source: Investor Presentation Q4 FY24
• SMA 1 is the overdue portfolio in Bucket 31-60 days, and SMA 2 is the overdue portfolio in 61-90 days.
• SMA 1 (31-60 days overdue) and SMA 2 (61-90 days overdue), put together are around 0.85% of the Book in Retail, Rural & SME segment.
• The SMA is broadly stable & based on low SMA, which is expected to give a lower level of NPA formation in the future.
Exhibit 9: Net Stressed Assets reduced to only 0.56% of total assets

Source: Investor Presentation Q4 FY24
• The Bank has reduced the net stressed assets, both in absolute value and as % of the total assets. This indicates lower NPA levels going forward.
• The restructured pool of the Bank has reduced by 36% since March 31, 2023.
• Standard restructured Book is 0.31% of the total funded assets as of March 31, 2024.
Exhibit 10: Provision Coverage Ratio increased to 86.6% for the Bank

Source: Investor Presentation Q4 FY24
• Provision Coverage Ratio (excluding technical write-offs) improved to 68.8% as on March 31, 2024, from 66.9% as on December 31, 2023; and compared to 66.4% as on March 31, 2023.
• Provision Coverage Ratio after excluding infrastructure finance book was at 73.4% as on March 31, 2024.
Exhibit 11: Infrastructure project financing the book brought down from 21,459 cr to 4,664 cr
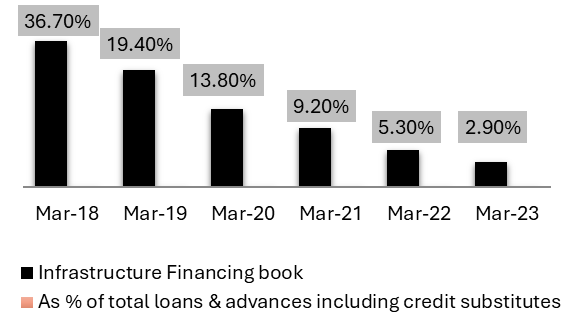
Source: Investor Presentation Q4 FY24
• Infrastructure “Project Financing”, like financing road or power plant projects are subject to project execution risks, and the bank has no appetite for such risk.
• Hence, it brought down infrastructure Financing book from 21,459 crore as of March 31, 2019, to 4,664 crore as of March 31, 2023, and bank will continue to run it down further.
Risk Management in Wholesale Financing
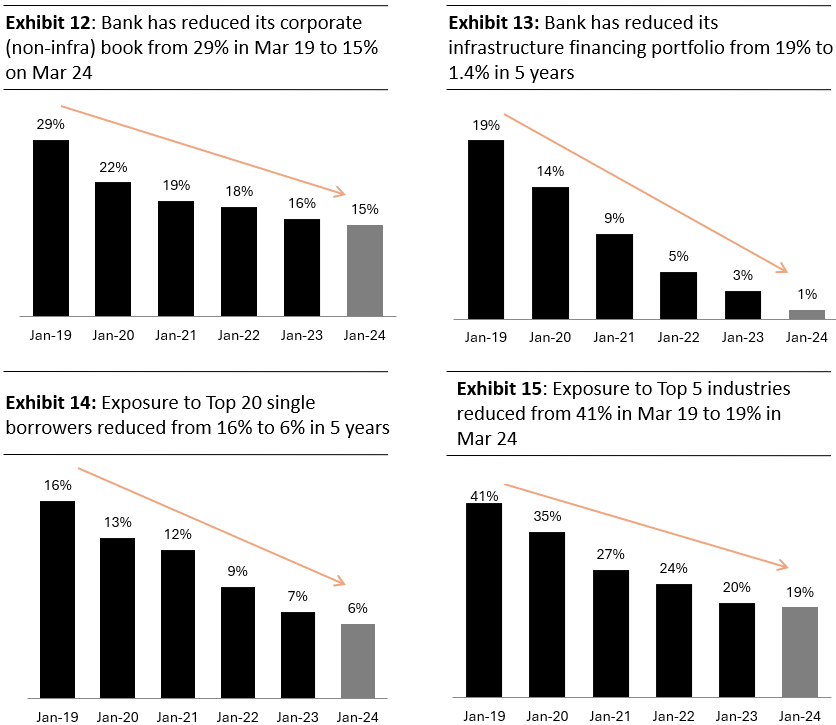
Source: Investor Presentation Q4 FY24
Exhibit 16: Bank has reduced Cost to Income Ratio from 95.1 to 72.9% in 5 year, despite investments
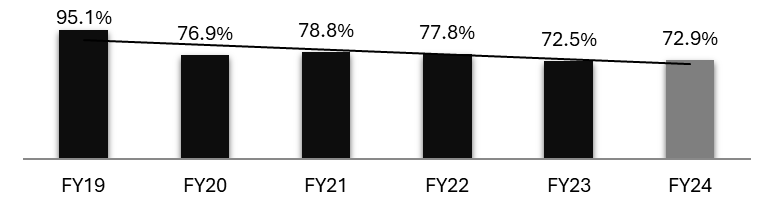
Source: Investor Presentation Q4 FY24
• During the last three years the bank had to make significant investments in building liabilities and credit card franchise.
• Despite this, the cost income ratio has come down from 95.1% to 72.9% because of the strong incremental unit economics at the bank which is allowing the bank to make the investments to build the Bank.
• Cost to income ratio for Q4 FY24 was at 73.2% as compared to 73.7% for Q3 FY24.
• Cost to income will further come down with scale.
Exhibit 17: Cost to Income improving with scale
Source: Investor Presentation Q4 FY24
Profitability & Capital
Exhibit 18: 30% YoY growth in Net Interest Income (in Rs. Cr) during FY24 against balance sheet growth of 23%

Source: Investor Presentation Q4 FY24
• Net Interest Margin (NIM) on AUM for FY24 was 6.36% as compared to 6.05% in FY23; for Q4-FY24 NIM stood at 6.35%.
• Cost of Funds for Q4-FY24 was 6.43%, marginally improved from 6.44% in Q3-FY24
• Cost of Deposits for Q4-FY24 was at 6.27% as compared to 6.20% for Q3-FY24
Exhibit 19: 31% YoY growth in Core Operating profit (excluding trading gains) (In Rs. Cr) during FY24

Source: Investor Presentation Q4 FY24
Loan book has grown at a 5-year CAGR of 13% while the operating profit has grown at a 5-Year CAGR of 40%, this represents strong incremental unit economics.
Exhibit 20: Operating profit as % of Total Assets improved

Source: Investor Presentation Q4 FY24
The bank has improved the core pre-provisioning operating profit despite investment in growing the bank. This was made possible as the retail lending business is profitable with more than 20% incremental ROE.
Exhibit 21: The Bank has turned profitable on a sustained basis based on strong operating profits & low credit costs
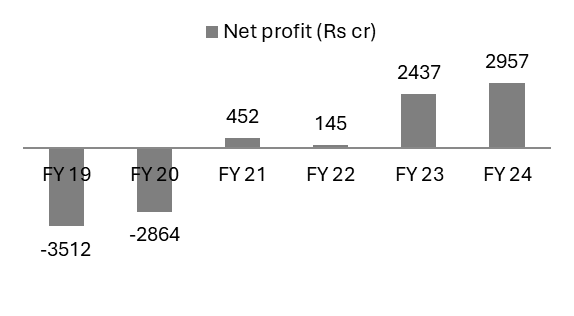
Source: Investor Presentation Q4 FY24
• The Bank posted 6 quarters of losses consecutively in FY19 and FY20 due to provision on legacy infrastructure portfolio and large corporate loans as well as goodwill write-off on merger.
• As the foundations pillars were built and businesses scaled up driving retail deposits and asset growth, the Bank started posting sustainable levels of profitability starting from FY23 and continued the same in FY24.