NSE: IDFCFIRSTB
P&L Analysis
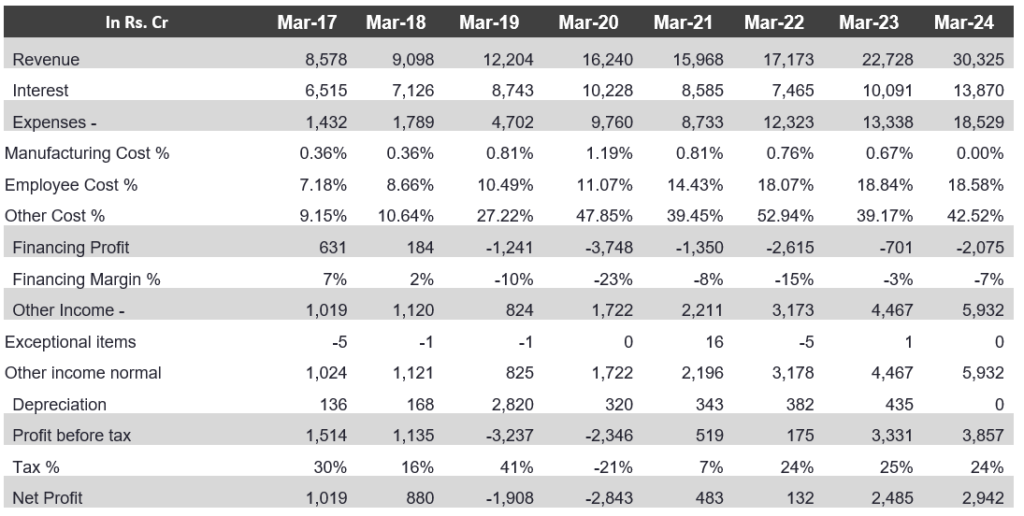
• The bank demonstrated substantial revenue growth of 550.56% in 2022; and 328.65% in 2023 driven by increased interest income and other income sources. However, rising operating costs by 33% YoY, particularly related to employee expenses and branch expansions, have impacted net margins with a decline of -11.27% in 2024.
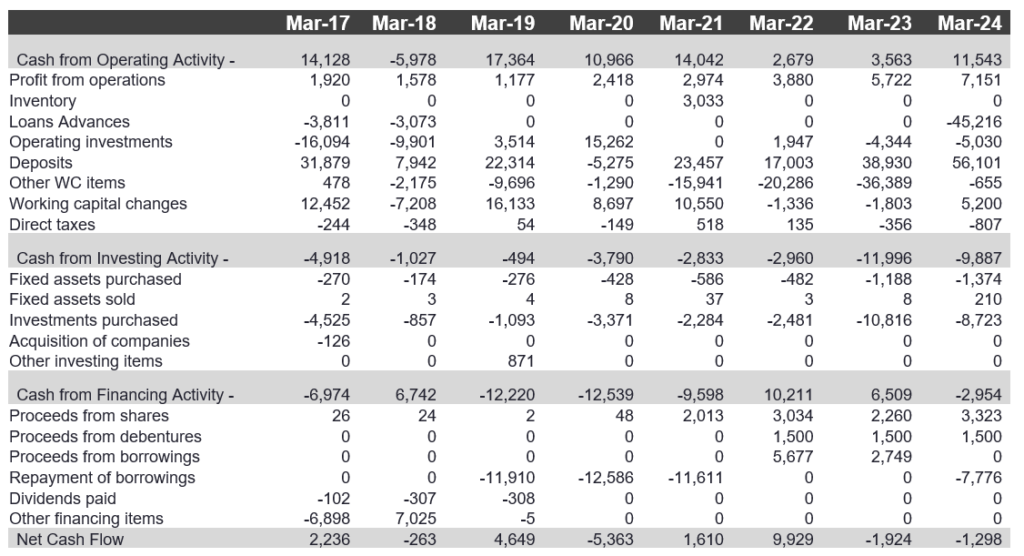
• Operating cash flow with continuous decline of -30% in 2022 & -92% in 2023. The recovery in operating cash flow in 2024 by 173.64% suggests better management of operational liquidity and an improvement in cash generation from core business activities.
• The volatility in EPS from -77% decline in 2022 to 1249% increase in 2023 and again a decline of -16% in 2024 underscores the challenges in maintaining consistent profitability.
• The bank’s focus on expansion and capital investments while no dividend payments aligns with a growth-oriented strategy aimed at enhancing shareholder value over the long term. The bank’s decision to retain all its earnings and reinvest them into growth initiatives appears to be paying off, as evidenced by the significant increases of 1782.58% in 2023 & 18.39% in 2024 in Gross PAT, and 32.35% increase in 2023 & 33.43% increase in 2024 in sales growth.
• The substantial increase in CapEx by 146.76% in 2023 & 32.42% in 2024 indicates a proactive approach to expand operations and enhance service offerings, which is crucial for sustaining long-term competitiveness. Despite lower operating cash flows in 2022 & 2023, the bank’s financial health seems improving, supported by increasing profitability and strategic investment decisions.
Balance Sheet Analysis
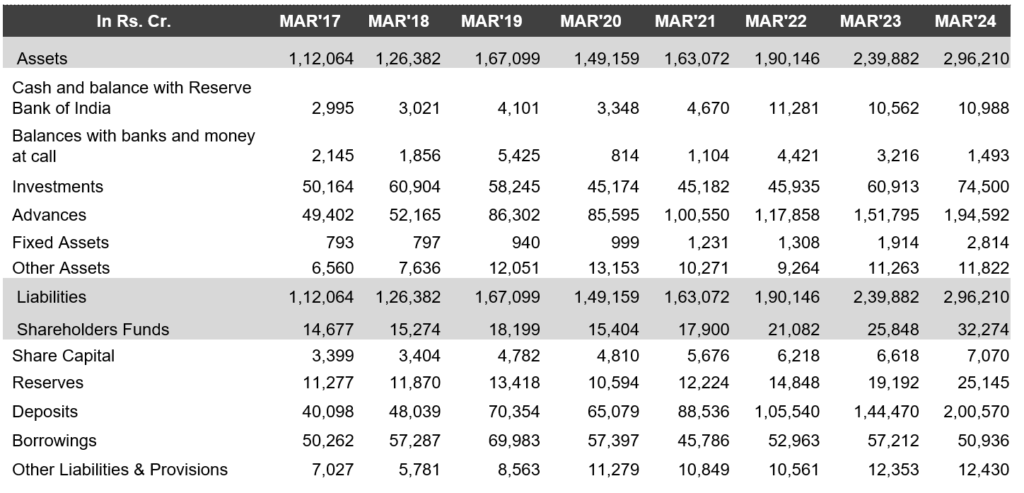
• Positive trajectory for a bank with revenue growth majorly in 2023 by 328.65%, improvement in operating cash flow with 223.97% in 2024 followed by continuous increase in reserves by 29% in 2024. Also, the bank has no long-term debt and relies on retained earnings to further invest in the expansion of branches and growth of the bank which led to an increase in CWIP by 177.22% in 2023. The rising trend in CWIP as a percentage of Gross Block of 12.90% in 2022 & 285.49% in 2023 indicates that the bank has been actively investing in new projects or capital expenditures.
• An increase in NOA of 29% in 2024 underscores the bank’s effective deployment of assets to enhance operational capabilities and revenue streams & growth in NOL with 20% in 2023 reflects the bank’s ability to manage and leverage its liabilities to support its expanding operations. The increasing Accrual Ratio from 10% in 2022 to 25% in 2023 reflects a robust pace of asset accumulation, which also points to future income generation and operational resilience.
• While the bank has shown robust growth in assets, liabilities, and net worth of around 23% in 2024, the rapid increase of contingent liabilities with 908.60% in 2022 & 68.54% in 2023 raises concerns. The disproportionate increase in contingent liabilities compared to net worth suggests increased exposure to potential future obligations and liquidity risks. The bank must enhance risk management practices, strengthen capital reserves, and closely monitor these liabilities to ensure sustainable financial stability in the future.
• Positive positioning of the bank with the continuous decline of 36.63% in 2022 & 4.56% in 2023 & 25.10% in 2024 in GNPA & a decline of 15% in 2022, 14% in 2023 & 40% in 2024 in NNPA, and decline of around 15% in 2024 in Net stressed assets/ total assets ratio indicating improved asset quality, lower risks, better capital adequacy & lower provisioning needs.
• Strong growth in deposits continuously with 19% in 2022 & 36% in 2023, even during the time of covid and after reducing interest rates of saving account deposits from 7% to 4%. The reason for continuous growth is the brand image of the bank and the building of fantastic products, a transparent & clean way of charging fees. Also, the future focus of the bank is still to raise deposits to set their ETB (existing to bank customers) & to use these deposits to repay their legacy liabilities until FY 25-26 and then the pressure of increasing deposits on the bank would be reduced & also these deposits would be used to fund the growth of the bank.
• Increase in Provision Coverage Ratio from 63.57% in 2021 to 80.29% in 2023 & decline in Cost to income ratio from 78% in 2021 to 72% in 2023 collectively suggest that IDFC First Bank is on a path towards stronger financial health, better risk management, and improved operational effectiveness. Continued focus on maintaining high provision coverage and optimizing operational costs will be essential for sustaining growth and profitability in the future.
• Bank has demonstrated robust growth in its capital base, particularly in CET 1 and total capital with an average growth rate of 28% in 2022 & 2023, which supports its ability to manage risks effectively and comply with regulatory requirements. The stable to slightly improving capital adequacy ratios from 13.77% in 2021 to 16.82% in 2023 over the years indicate prudent capital management and readiness to support continued business growth while maintaining financial stability. These factors collectively contribute to a positive outlook on the bank’s capital adequacy and financial health.
• The bank’s growth in advances and deposits market share reflects improved market penetration and customer acquisition efforts. But compared to the banking industry of Rs.21267757 cr of bank deposits, the bank’s share is very small which shows a significant opportunity for growth. Also, loan (personal credit, rural finance & small business credit) is Rs. 86 trillion ($1.1 T) and creates a lot of scope for the bank to increase their share. Also, the bank started its credit card business in late 2018 and is showing a good % of growth YoY with 109.43% in 2022, 30.63% in 2023 & 25.52% in 2024. In summary, within 5 years bank can make its place in the market and should show a continued focus on innovation, digital transformation, and customer-centric strategies as it will be crucial for maintaining and enhancing its market leadership across these segments.
Profit & Loss Statement
Balance Sheet
Cash Flow Statement
Financial Ratios


