
Written By: Kaushal Sharma
In trading, indicators are mathematical tools used to analyze past price movements, volume, or other market data to help traders make informed decisions about future price actions. These indicators provide valuable insights into market trends, momentum, volatility, and potential reversals, and can help traders identify entry and exit points.
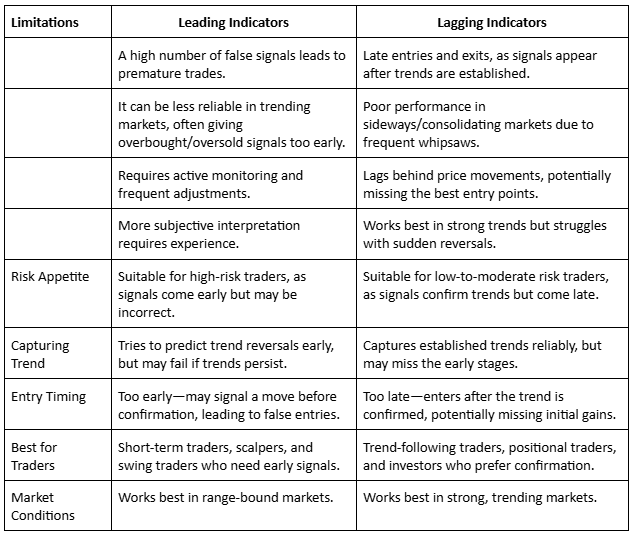
Indicators can be broadly classified into two categories: leading indicators and lagging indicators.
Leading Indicators: These helps forecast future price movements. They often provide early signals of potential trends. Examples include the Relative Strength Index (RSI) and Moving Average Convergence Divergence (MACD). These tools are useful for predicting reversals or trend continuations before they happen.
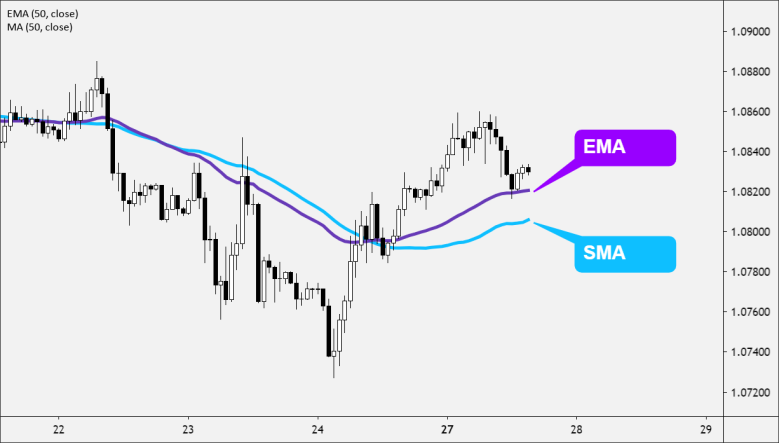
Lagging Indicators: These are used to confirm trends that have already started. They tend to follow the market's action and are less useful for predicting future changes. Common lagging indicators include Moving Averages (MA) and the Average Directional Index (ADX). They help traders gauge the strength and duration of a trend, rather than its direction.
Leading Indicators:
Leading indicators are used primarily for predicting future price movements. They aim to provide early warnings or signals of upcoming trends. Traders rely on leading indicators to catch potential reversals, or trend shifts before they fully develop. Here’s a breakdown of the key points:
Characteristics of Leading Indicators:
- Predictive Nature: Leading indicators anticipate future price movements, helping traders to make decisions ahead of time.
- Early Entry Signals: By providing signals in advance, these indicators can help traders enter positions early, potentially maximizing profits if trends play out as expected.
- Volatility: They can sometimes be more volatile or less reliable in comparison to lagging indicators, as they react to market conditions more quickly.
Examples of Leading Indicators:
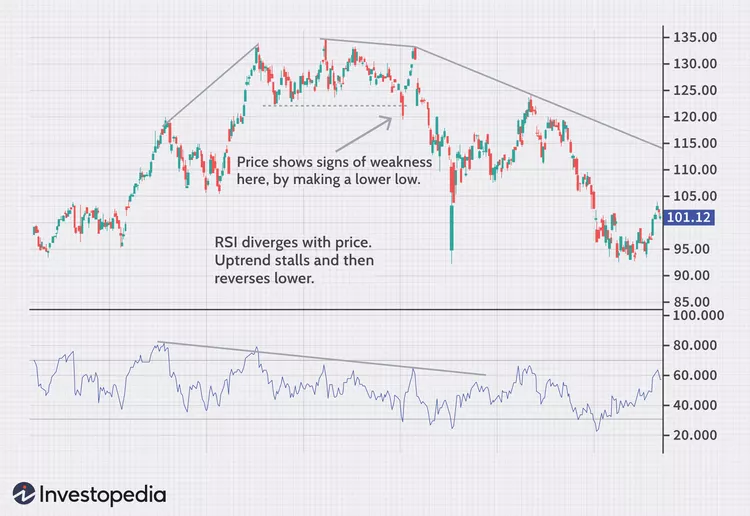
Relative Strength Index (RSI): The Relative Strength Index (RSI) is a momentum oscillator that measures the speed and magnitude of recent price changes to evaluate overbought or oversold conditions in a market. RSI values range from 0 to 100, with readings above 70 typically indicating overbought conditions and readings below 30 suggesting oversold conditions. Traders use RSI to identify potential trend reversals and confirm price momentum. Additionally, RSI can help detect bullish or bearish divergences, where price action and RSI movement diverge, often signaling a trend shift.
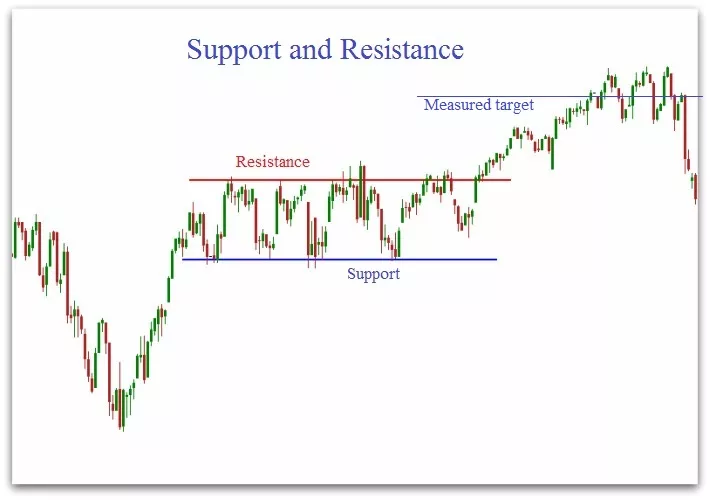
Fibonacci Retracement: It is a widely used technical analysis tool that helps traders identify potential support and resistance levels in the market. The concept behind Fibonacci retracement is based on the idea that markets tend to retrace or pull back a predictable portion of a previous move before continuing in the original direction. This concept is derived from the Fibonacci sequence, a series of numbers where each number is the sum of the two preceding ones, and the key ratios derived from it are used to predict potential price levels.
1. 100% Fibonacci Retracement indicates a future market price reversal
2. 0% indicates a future market trend confirmation
3. 61.8% indicates a weak future trend

Comments
Log in to comment and join the discussion.
No comments yet. Be the first to comment.